| X Value | Y Value | Color | Action |
|---|
⚙️ Customize Chart
📥 Download Options
Text to graph generator turns a short list of numbers into a chart you can use in a report, a slide, or a handout. You type your values into a table, choose a chart type, and click Generate Chart. Along with PNG and PDF, you can export your data to Excel or JSON. There is nothing to install and no account to create, because the whole tool runs in your browser.
Examples you can try
Each example below uses values you can type straight into the table. Delete the three sample rows with the ❌ button, enter the rows, choose the chart type, and click Generate Chart.
Regional sales as a bar chart
Enter the regions in the X Value column and the sales totals in the Y Value column: North with 120, South with 95, East with 140, and West with 80. Choose Bar and click Generate Chart. Give each bar its own color with the Color column. Bars make it easy to see that East is the highest and West is the lowest.
Weekly visitors as a line chart with a prediction
Enter Week 1 through Week 4 in the X Value column as 1, 2, 3, and 4. Enter 42, 51, 63, and 70 in the Y Value column. Choose Line and click Generate Chart. Then click Predict Y. The tool adds a row with X set to 5 and Y set to 80.50. The chart does not update on its own, so click Generate Chart again to show the new point.
Because Predict Y uses your X values, the X column must hold numbers here. If you type “Week 1,” the tool cannot calculate a prediction.
Study hours and exam scores as a scatter chart
Enter 1, 2, 3, 4, and 5 in the X Value column for hours studied. Enter 52, 58, 65, 71, and 78 in the Y Value column for scores. Click Suggest Chart. Because the score changes between neighbors are all more than 2, the tool switches the chart type to scatter. You can click Generate Chart to see the points.
Scatter charts need numbers in the X column, the same as Predict Y. Text labels here would not plot as expected.
A monthly budget as a pie chart
Enter Rent with 900, Food with 400, Transport with 150, and Other with 250 in the table. Choose Pie and click Generate Chart. Rent takes up just over half of the total of 1,700, so it is the largest slice. Keep the list short, since a pie with more than five or six slices is harder to read.
Entering data in this text to graph generator
The table opens with three sample rows so you can see a chart before you change anything. Click any cell to edit it. The X Value column holds labels or numbers along the horizontal side of the chart. The Y Value column holds the numbers the chart plots. The Color column sets the color for that row’s bar, slice, or point.
Use Add Row to create a new line and the ❌ button at the end of a row to delete it. Clear Data resets the table to the three sample rows. A row with an empty or non-numeric Y value stays in the table but is left out of the chart and of any download.
The tool does not read pasted text or spreadsheet cells in bulk, so you type each value into the table. For a long list, plan on a few minutes of entry.
Picking a chart type
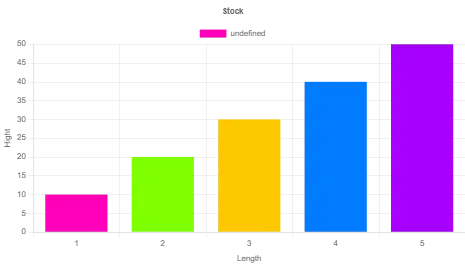
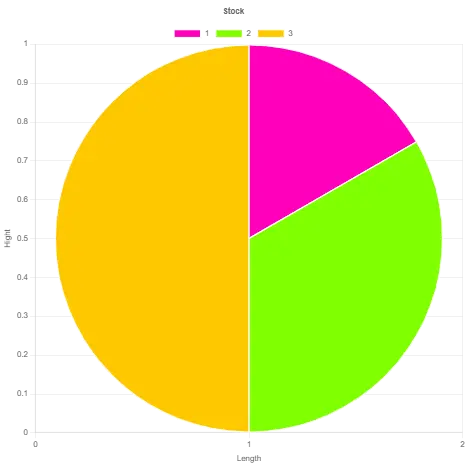
Bar charts work best for comparing separate categories, such as sales by region. Line charts suit values that change in sequence, such as monthly visitors over a year. Pie charts show how parts add up to one whole, so keep the number of slices small, since thin slices are hard to compare. Scatter charts plot pairs of numbers against each other, such as hours studied against exam score, and you should put numbers in the X column for those.
Pie charts have no axes, so the X and Y axis label boxes will not appear on them. If you are new to chart design, the Chart.js documentation explains how the library draws each type this tool uses.
Titles and axis labels
The Chart Title box sets the heading above the chart. The X-Axis Label and Y-Axis Label boxes name the two axes. Fill these in before you click Generate Chart, because the labels are applied when the chart is drawn. If you change them later, generate the chart again.
Predict and suggest
The Predict Y button fits a straight line through your X and Y values and adds one new row at the next X value. You need at least two rows with numbers in both columns. Because the calculation reads X as a number, the X column must hold numbers. It is useful for a rough next value in a steady sequence, but it is not a forecast to rely on for anything important.
The Suggest Chart button checks your Y values in order. If no two neighboring values differ by more than 2, it switches the chart type to line. Otherwise it switches to scatter. The rule is simple and the threshold is fixed, so treat the suggestion as a starting point and change the chart type yourself if it does not fit your data.
Downloading your chart and data
The Download menu offers four formats. PNG saves the chart as an image. PDF places that same chart image on one page, so generate the chart first. Excel saves your X, Y, and Color columns into a sheet named Sheet1. JSON saves the same rows as a list of objects. The Excel and JSON files do not include the chart title or axis labels.
For the regional sales example, the JSON file looks like this, with the default color on each row:
[
  { "x": "North", "y": 120, "color": "#007bff" },
  { "x": "South", "y": 95, "color": "#007bff" },
  { "x": "East", "y": 140, "color": "#007bff" },
  { "x": "West", "y": 80, "color": "#007bff" }
]
If you changed the bar colors, the color values will match your choices.
What the tool does not do
The tool does not read pasted paragraphs, spreadsheet ranges, or CSV files. It exports to PNG, PDF, Excel, and JSON only, so there is no SVG or JPG option. Each chart shows one set of values, and you cannot change fonts or legend settings.
On a phone
The layout adapts to small screens. The buttons stack in a single column, and the chart fills the width of the screen. The table scrolls sideways when it is wider than the screen, so you can still reach the Color and Action columns.
Start with the sample rows, replace them with your own numbers, and click Generate Chart. For most small data sets, that takes under a minute. For more tools like this one, see the DailyToolSpot tool library.
Frequently Asked Questions
No. You do not need an account, a download, or an app. The tool runs in your browser, but it loads its chart library from a web address, so you need an internet connection to use it.
Not directly. You type or edit each value in the table. Copying a spreadsheet and pasting it into the table is not supported, so plan for manual entry.
No. The tool does not accept CSV uploads. You enter the values in the table.
You can make bar, line, scatter, and pie charts. Each chart shows a single set of values from the Y column.
The code on this page does not send your table values anywhere. The numbers stay in your browser tab. They are not saved when you close or reload the page, so export your work before you leave.
No. Predict Y fits a straight line through your numbers, and Suggest Chart compares neighboring values with a fixed threshold. Neither uses an AI model.
You can set a color for each row, which applies to that row’s bar, slice, or point. You cannot change fonts, and there is no color theme or legend setting.